Create Crypto HEATmap

Hello,

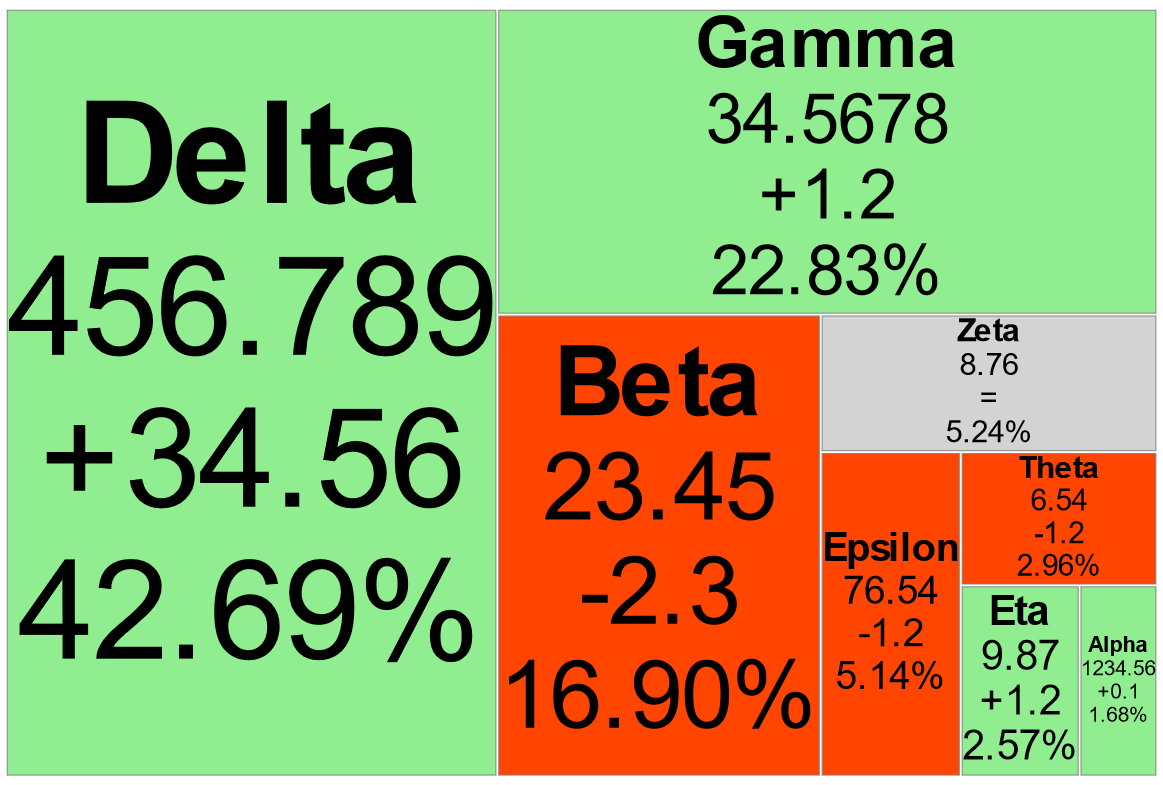
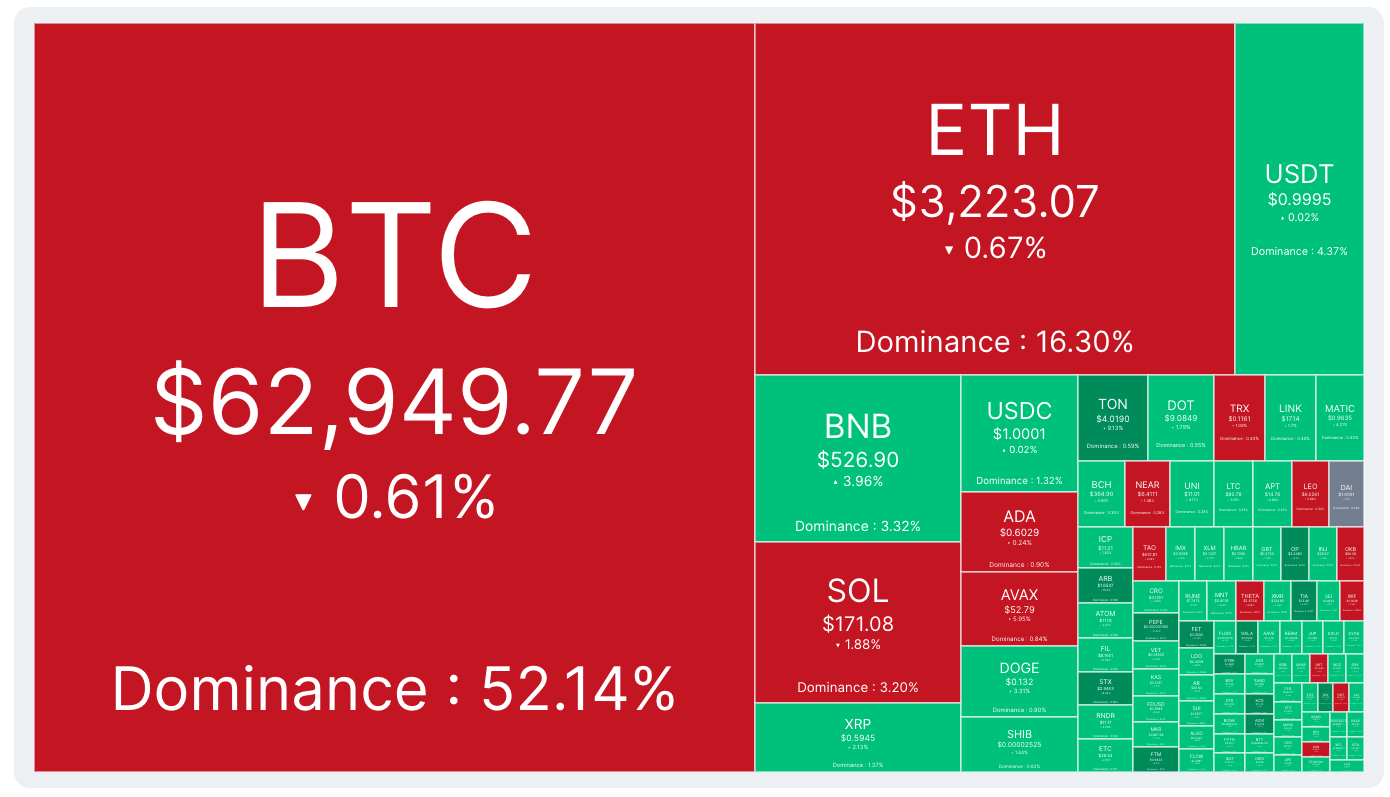
I would like to recreate this kind of “crypto heatmap”. But I’m not sure if it’s something that I can do with GoJS ? If someone can help me I would appreciate a lot !

Here is the data I get from my API (not sure it’s useful) :

[
        {
            "address": "resource_rdx1tknxxxxxxxxxradxrdxxxxxxxxx009923554798xxxxxxxxxradxrd",
            "icon_url": "https://assets.radixdlt.com/icons/icon-xrd-32x32.png",
            "market_cap": {
                "circulating": {
                    "usd": {
                        "1h": "308821060.90770062095835056",
                        "24h": "306880631.35303390684494634",
                        "7d": "236116623.89170567730906244",
                        "now": "304210591.32222796291432990"
                    },
                    "xrd": {
                        "1h": "4684923754",
                        "24h": "4684923754",
                        "7d": "4684923754",
                        "now": "4684923754"
                    }
                },
                "fully_diluted": {
                    "usd": {
                        "1h": "843557561.0698701920314472817470885055445792",
                        "24h": "838257197.1058600819387017970778440522301788",
                        "7d": "644962370.0945341593744872202901315962350808",
                        "now": "830963871.8069784990782208453651734880628180"
                    },
                    "xrd": {
                        "1h": "12797063918.20116688722513628",
                        "24h": "12797063918.20116688722513628",
                        "7d": "12797063918.20116688722513628",
                        "now": "12797063918.20116688722513628"
                    }
                }
            },
            "name": "Radix",
            "price": {
                "usd": {
                    "1h": "0.06591805483366264",
                    "24h": "0.06550386889242721",
                    "7d": "0.05039924581272186",
                    "now": "0.06493394712400435",
                    "percent_change": {
                        "24h": "-0.00870058178332650636",
                        "7d": "0.28839124627562615113"
                    }
                },
                "xrd": {
                    "1h": "1",
                    "24h": "1",
                    "7d": "1",
                    "now": "1",
                    "percent_change": {
                        "24h": "0.00000000000000000000",
                        "7d": "0.00000000000000000000"
                    }
                }
            },
            "rank": 3,
            "slug": "xrd",
            "symbol": "XRD",
            "volume": {
                "token": {
                    "1h": "279425.026569695155384439",
                    "24h": "12761699.243332342185218934",
                    "7d": "129650701.252297120228691951",
                    "total": "354829695.685357455998502051"
                },
                "usd": {
                    "1h": "18378.54894231105121859738256104249340700",
                    "24h": "843446.29659308675846852068782957569743034",
                    "7d": "8412605.998580207200969001345879562529943947"
                },
                "xrd": {
                    "1h": "279425.026569695155384439",
                    "24h": "12761699.243332342185218934",
                    "7d": "129650701.252297120228691951"
                }
            }
        },
        {
            "address": "resource_rdx1t5kmyj54jt85malva7fxdrnpvgfgs623yt7ywdaval25vrdlmnwe97",
            "icon_url": "https://i.imgur.com/TjciHNV.png",
            "listed_at": "2023-12-30T00:05:18.190016Z",
            "market_cap": {
                "circulating": {
                    "usd": {
                        "1h": "5203412.68569764048715429600224031846303497157835083263008279744642889500402",
                        "24h": "5074008.9730546249725874465426166250725881216158267459575153616282472820668746",
                        "7d": "2732916.4553801388054767509500043790501298486296456874004130969206355847435828",
                        "now": "5280694.747360507005044751966159710254557351010706977312447057620757311415795"
                    },
                    "xrd": {
                        "1h": "79198366.8796914444210787178796770525852652951633086073648709",
                        "24h": "77251828.00797090421852611009300928493173875121802954136628689",
                        "7d": "54225344.27470126085026058004312205376895651677955367831825698",
                        "now": "80136388.39603032159820505751128235258836895723807618527957515"
                    }
                },
                "fully_diluted": {
                    "usd": {
                        "1h": "9587767.315411155628594434395541774963548978071400000000000",
                        "24h": "9349329.05161905025728887374423633717421185759792200000000000",
                        "7d": "5035650.37973341742321656604444018124679083623139600000000000",
                        "now": "9730166.6347877384939490255646033529314267657581500000000000"
                    },
                    "xrd": {
                        "1h": "145930288.30678651908592877354651300000000000",
                        "24h": "142343611.081711242871315709842737300000000000",
                        "7d": "99915193.144860717819604520209698600000000000",
                        "now": "147658679.379865609736341170556185500000000000"
                    }
                }
            },
            "name": "Hug",
            "price": {
                "usd": {
                    "1h": "0.000095877673154111556285944343955417749635489780714",
                    "24h": "0.00009349329051619050257288873744236337174211857597922",
                    "7d": "0.00005035650379733417423216566044440181246790836231396",
                    "now": "0.0000973016663478773849394902556460335293142676575815",
                    "percent_change": {
                        "24h": "0.04073421537160867118932865085774029440992142208322096",
                        "7d": "0.93225619354909312211446508413628873990506180302813849"
                    }
                },
                "xrd": {
                    "1h": "0.00145930288306786519085928773546513",
                    "24h": "0.001423436110817112428713157098427373",
                    "7d": "0.000999151931448607178196045202096986",
                    "now": "0.001476586793798656097363411705561855",
                    "percent_change": {
                        "24h": "0.037339703958355343719229229340128419",
                        "7d": "0.477840103514433801060081436243514175"
                    }
                }
            },
            "rank": 4,
            "slug": "hug",
            "symbol": "HUG",
            "volume": {
                "token": {
                    "1h": "18933157.782677828393220833",
                    "24h": "543500463.499654559123232199",
                    "7d": "13357757510.811583191432203413",
                    "total": "262297304243.117258142478644215"
                },
                "usd": {
                    "1h": "1842.45990434273390442566153802361822683552698654807050840720186130524083853",
                    "24h": "51999.85107799277722166441203264227194066085868898360430365377200001280121286",
                    "7d": "1118300.896087059589901047123565080249726770377711287549156470581575976484488137"
                },
                "xrd": {
                    "1h": "27920.984682364930814472494917861937533414485333734449344147",
                    "24h": "786577.064947118582003154458030083797972089464540765033892632",
                    "7d": "17728387.847703864708799609234768788885728213685175355644766210"
                }
            }
        },
...
]

Best regards,

Cédric

The data does help – thanks! But I’m not sure what is what.

Also, is the data just a simple Array? Is there any implicit hierarchy (grouping) of the data? Or should all of the data just be top-level nodes showing name/price/change/pct?

The TreeMap sample assumes that the data is hierarchical: Tree Map

There is also a variation where the leaf nodes show some text: Tree Totals

However, both of those samples depend on grouping (literally Groups of Nodes) in order to arrange everything based on (percentage of) total area. If your data does not have grouping, then the TreeMapLayout won’t work well for you.

Thank you for your response !

  • The size of each block is defined by it’s dominance (market_cap. fully_diluted.usd.now) for each of my objects in the JSON.
  • The color (red / green) is defined by the comparison between now and 24h. Depending on if now is superior or not. We can also use data from the price property of each object.

It’s actually just an array yes, but I can format / calculate the data to get the dominance etc… if needed.

I tried with Treemap but it’s not well ordered from Top left to bottom right.
Sorry for the inconvenience.

Here is CoinMarketCap.com heatmap using D3.js.
https://coinmarketcap.com/crypto-heatmap

Cédric

OK, later today when I have some free time I’ll see if I can create a new TreeMap algorithm for you that is appropriate for this kind of data.

1 Like

It would probably be best if you could convert your data into a simpler form that is easier to understand. It isn’t necessary, but it might make it easier to define the node template. For now I’ll assume that there are four properties: “name”, “val”, “diff”, and “pct”.

TreeMapLayout and really all “tree maps” assume that the data is organized in a tree structure (that’s why they are called “tree” maps). Since you have a flat structure, you could use PackedLayout. That’s easy to do in GoJS. For example:

<!DOCTYPE html>
<html>
<head>
  <title>Minimal GoJS Sample</title>
  <!-- Copyright 1998-2024 by Northwoods Software Corporation. -->
</head>
<body>
  <div id="myDiagramDiv" style="border: solid 1px black; width:100%; height:600px"></div>

  <script type="importmap">{"imports":{"gojs":"https://unpkg.com/gojs@beta/release/go-debug-module.js"}}</script>
  <script id="code" type="module">
import * as go from "gojs";
import { PackedLayout } from "https://unpkg.com/create-gojs-kit@beta/dist/extensionsJSM/PackedLayout.js";

const myDiagram =
  new go.Diagram("myDiagramDiv", {
    layout: new PackedLayout()
  });

const SCALE = 3;
myDiagram.nodeTemplate =
  new go.Node("Viewbox")
    .bind("background", "diff", v => v < 0 ? "red" : (v > 0 ? "lightgreen" : "gray"))
    .bind("desiredSize", "pct", v => new go.Size(v*SCALE, v*SCALE*1.25))
    .add(
      new go.Panel("Vertical")
        .add(
          new go.TextBlock().bind("text", "name"),
          new go.TextBlock().bind("text", "val"),
          new go.TextBlock().bind("text", "diff"),
          new go.TextBlock().bind("text", "pct"),
        )
    );

myDiagram.model = new go.Model(
[
  { name: "Alpha", val: 12.34, diff: 0.1, pct: 16.7 },
  { name: "Beta", val: 23.45, diff: -2.3, pct: 17.0 },
  { name: "Gamma", val: 34.5678, diff: 1.2, pct: 23.1 },
  { name: "Delta", val: 456.789, diff: 34.56, pct: 43.2 }
]);
  </script>
</body>
</html>

Of course this doesn’t produce a rectangular layout in a particular aspect ratio. I’ll work on that later.

Thank you for your efforts !

I’ve spent the day on this and I’m still far from what I’m looking for. Pretty sure the solution is just here in front of me.

I let you know if I make progress.

Cédric

Few more links to explain the concept :
https://cryptorank.io/heatmaps
https://coinmarketcap.com/crypto-heatmap/
https://coin360.com/

Try this:

<!DOCTYPE html>
<html>
<head>
  <title>Rectangular Pack Layout</title>
  <!-- Copyright 1998-2024 by Northwoods Software Corporation. -->
  <meta name="description" content="RectangularPackLayout fills a rectangular area with nodes that are sized according to their fraction of the total data.size property values." />
  <meta name="viewport" content="width=device-width, initial-scale=1">
</head>
<body>
  <div id="myDiagramDiv" style="border: solid 1px black; width:100%; height:600px"></div>

  <script src="../latest/release/go.js"></script>
  <script id="code">
// This layout arranges and sizes each Node or simple Part so as to pack a rectangular area.
// This is like the TreeMapLayout extension, but simpler because this only deals in a flat
// collection of nodes, whereas TreeMapLayout operates on a tree structure.
//
// The bounds of each node will have an area proportional to its data.size value relative
// to the sum of all of the data.size values.  The layout computes and stores the data.sizeFrac property
// based on each node's data.size fraction of the total.
//
// It is normal to use a "Viewbox" Panel so as to automatically scale what you want to show
// in each node so that it stays legible as the nodes get smaller and smaller for as long as possible.
//
// The layout sorts the nodes by decreasing data.sizeFrac and then arranges and sizes each node in sequence.
// It places nodes in order in the available space in the current direction, either towards the right
// or downwards, sizing each node to fill the available breadth in the other direction.
// When a fraction, determined by the turnSpot property, of the available distance is passed,
// it switches direction and continues in the smaller area.
//
// By default Layout.isViewportSized is true, which will cause the layout to arrange everything
// to fit the viewport (minus Diagram.padding).
// When Layout.isViewportSized is false, this will use the value of the targetSize property,
// which defaults to 600x400.
class RectangularPackLayout extends go.Layout {
  constructor(init) {
    super();
    this.name = "RectangularPack";
    this.isViewportSized = true;
    this._targetSize = new go.Size(600, 400);
    this._spacing = new go.Size(0, 0);
    this._turnSpot = new go.Spot(0.3333, 0.3333);
    if (init) Object.assign(this, init);
  }

  // Gets and sets the size of the rectangular area to fill
  // when Layout.isViewportSized is false.
  // This defaults to 600 x 400.
  get targetSize() { return this._targetSize; }
  set targetSize(val) {
    const old = this._targetSize;
    if (!old.equals(val) && val.isReal()) {
      this._targetSize = val.copy();
      this.invalidateLayout();
    }
  }

  // Gets and sets the space between the nodes.
  // This defaults to 0 x 0.
  get spacing() { return this._spacing; }
  set spacing(val) {
    const old = this._spacing;
    if (!old.equals(val) && val.isReal()) {
      this._spacing = val.copy();
      this.invalidateLayout();
    }
  }

  // Gets and sets the Spot specifying the fractions
  // of the remaining space, when passed, at which to change direction.
  // Depending on the natural aspect ratio of your nodes,
  // you may want to adjust this to have different fractions for x and y.
  // This defaults to Spot(0.3333, 0.3333).
  get turnSpot() { return this._turnSpot; }
  set turnSpot(val) {
    const old = this._turnSpot;
    if (!old.equals(val)) {
      this._turnSpot = val.copy();
      this.invalidateLayout();
    }
  }

  doLayout(coll) {
    const diag = this.diagram;
    if (!diag) return;
    let w = this.targetSize.width;
    let h = this.targetSize.height;
    if (this.isViewportSized) {
      const vb = diag.viewportBounds.copy();
      vb.subtractMargin(diag.padding);
      w = vb.width;
      h = vb.height;
    }
    if (w < 1 || h < 1) return;
    diag.startTransaction("RectangularPackLayout");
    // get collection of Node-like Parts -- ignoring all Links
    const blocks = new go.List(this.collectParts(coll).filter(p => !(p instanceof go.Link)));
    let tsize = 0.0;
    blocks.each(b => tsize += (b.data.size || 1));
    blocks.each(b => {
      const frac = (b.data.size || 1) / tsize;
      diag.model.set(b.data, "sizeFrac", frac);
    })
    blocks.sort((a, b) => b.data.sizeFrac - a.data.sizeFrac);
    const left = this.arrangementOrigin.x;
    const top = this.arrangementOrigin.y;
    this._layoutRect(blocks, 0, left, top, left + w, top + h, w*h, w > h);
    diag.commitTransaction("RectangularPackLayout");
  }

  _layoutRect(blocks, idx, left, top, right, bottom, area, horiz) {
    let x = left;
    let y = top;
    let i = idx;
    while (i < blocks.count) {
      const block = blocks.elt(i);
      const newarea = block.data.sizeFrac * area;
      let w;
      let h;
      if (horiz) {
        h = bottom - y;
        w = newarea/h;
      } else {
        w = right - x;
        h = newarea/w;
      }
      block.desiredSize = new go.Size(Math.max(0, w - this.spacing.width),
                                      Math.max(0, h - this.spacing.height));
      block.moveTo(x, y);
      let turn = false;
      if (horiz) {
        x += w;
        turn = (x - left) > (right - left) * this.turnSpot.x;
      } else {
        y += h;
        turn = (y - top) > (bottom - top) * this.turnSpot.y;
      }
      i++;
      if (turn) horiz = !horiz;
    }
  }
}


const myDiagram =
  new go.Diagram("myDiagramDiv", {
    isReadOnly: true,
    layout: new RectangularPackLayout({ spacing: new go.Size(1, 1) })
  });

myDiagram.nodeTemplate =
  new go.Node("Auto")
    .add(
      new go.Shape({ fill: null, stroke: "gray", strokeWidth: 0.5 })
        .bind("fill", "diff", v => v < 0 ? "orangered" : (v > 0 ? "lightgreen" : "lightgray")),
      new go.Panel("Viewbox", { stretch: go.GraphObject.Fill })
        .add(
          new go.Panel("Vertical")
            .add(
              new go.TextBlock({ font: "bold 10pt sans-serif" }).bind("text", "name"),
              new go.TextBlock().bind("text", "val"),
              new go.TextBlock().bind("text", "diff", v => v > 0 ? ("+"+v) : (v < 0 ? v : "=")),
              new go.TextBlock().bind("text", "sizeFrac", v => (v*100).toFixed(2) + "%"),
            )
        )
    );

myDiagram.model = new go.Model(
[
  // The "size"s are summed and used to calculate the "sizeFrac" percentage;
  // the "size" defaults to 1 if not present.
  // The rest of the properties do not matter to RectangularPackLayout.
  { name: "Alpha", val: 1234.56, diff: 0.1, size: 17 },
  { name: "Beta", val: 23.45, diff: -2.3, size: 171 },
  { name: "Gamma", val: 34.5678, diff: 1.2, size: 231 },
  { name: "Delta", val: 456.789, diff: 34.56, size: 432 },
  { name: "Epsilon", val: 76.54, diff: -1.2, size: 52 },
  { name: "Zeta", val: 8.76, diff: 0, size: 53 },
  { name: "Eta", val: 9.87, diff: 1.2, size: 26 },
  { name: "Theta", val: 6.54, diff: -1.2, size: 30 },
]);
  </script>
</body>
</html>

You can easily change the styling by modifying the node template.

1 Like

Wow thank you very much, that’s exactly what I need!

I’m trying now with my data. I’m not sure how size is calculated if you can detail this point ?

Edit : Nevermind I Understand now. That’s perfect thank you !

Cédric

I have updated the code above with additional features and documentation. I think it’s good enough we could create another extension from it. Tell me if you think of anything that could be improved. Remember that the design of each node in each app is completely independent of the layout.